
Projections
Why Projections in this course?
If you gather spatial data for your project, in own field campaigns or through download form different web sources there is a very high chance that the projection i.e. the coordinate reference system is not the same for all data. During processing, in the best case you will get error messages left and right about missmatches due to different projections. In the worst case, function still work without errors, however, the results will not be the one you desire. For a proper processing and analysis of spatial data in R, handling projection is therefore crucial for trustful results. In short:
- In R, there is no “on the fly” projection
- some functions change the projection internally, some not This is problematic
- Consequence for you: Check that every dataset is in the same projection.
- Projections in R are defined as
- a WKT2 String
- a proj4string (kind of outdated)
- a EPSG Code
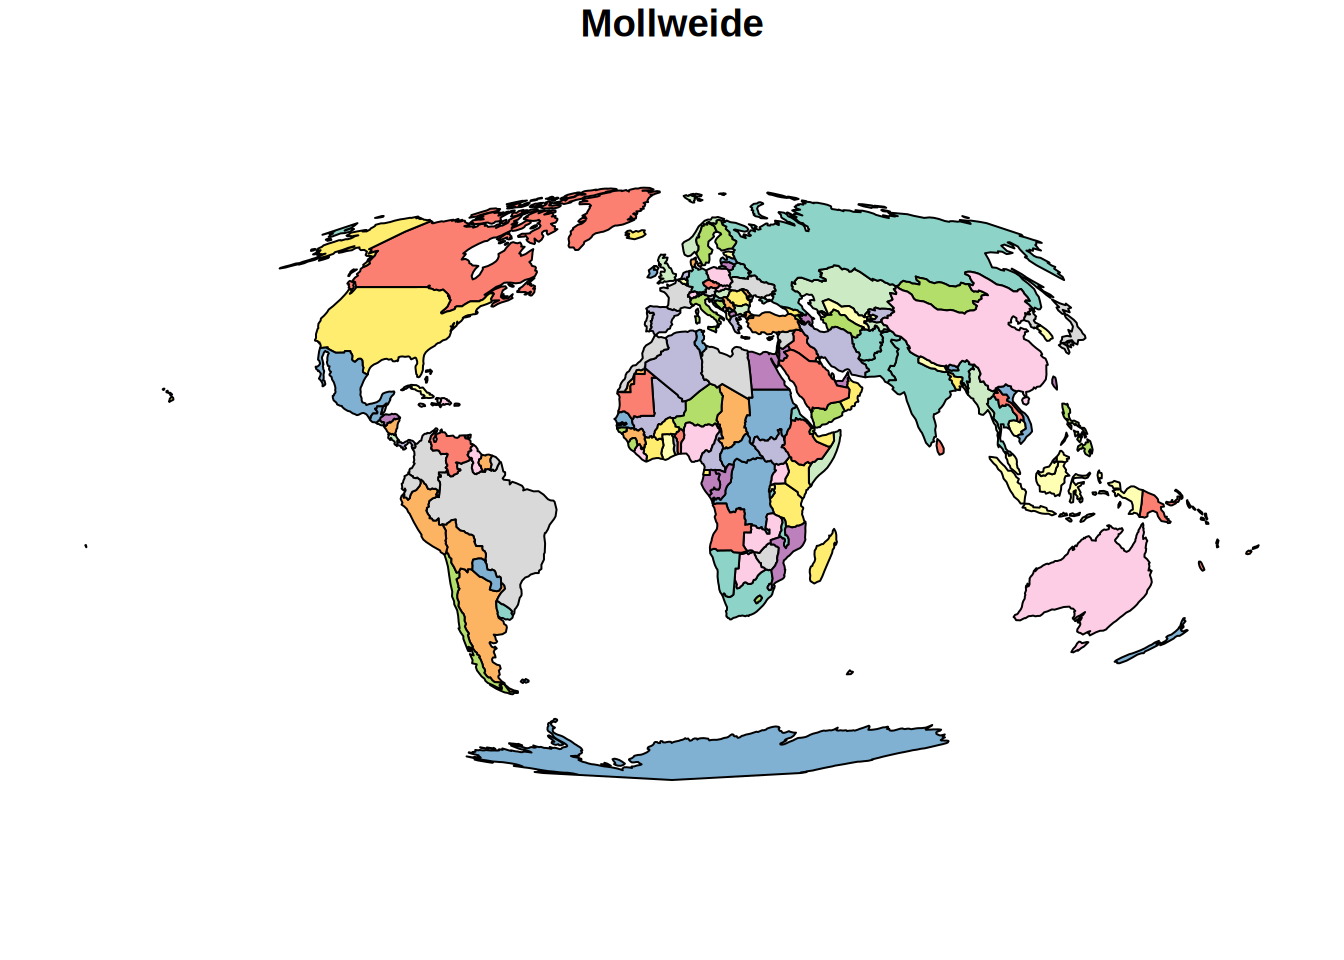
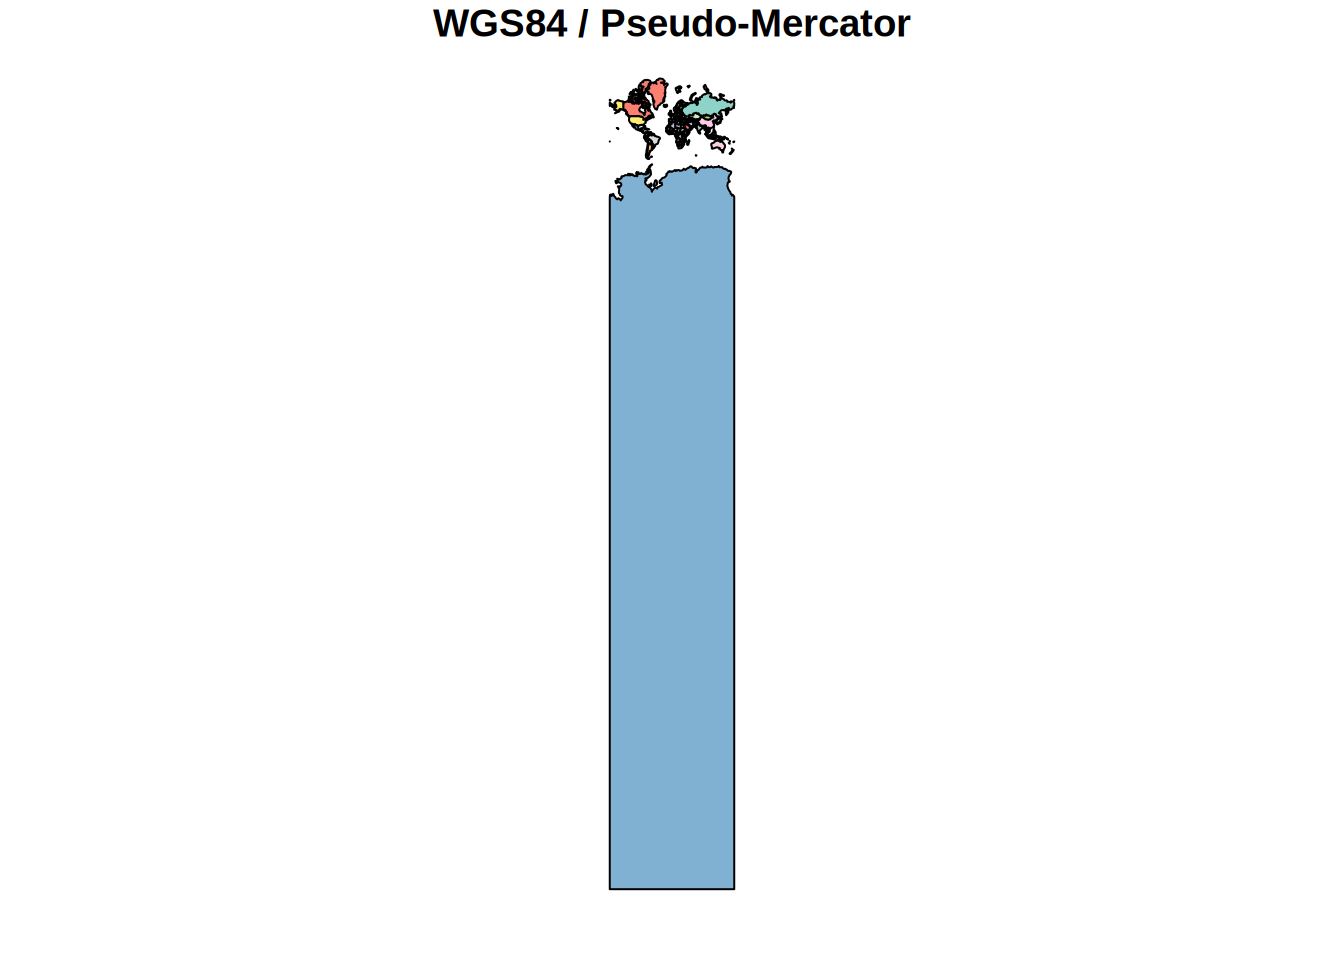
About map projections and some Examples
A field guide to map projections:
https://cdn.shopify.com/s/files/1/0279/4094/5994/files/WEM_Map_Projections2020_2.jpg?v=1580582102
Interactive website to compare different projections: https://map-projections.net/imglist.php
Projections in R
Raster
class       : SpatRaster
dimensions  : 90, 95, 1  (nrow, ncol, nlyr)
resolution  : 0.008333333, 0.008333333  (x, y)
extent      : 5.741667, 6.533333, 49.44167, 50.19167  (xmin, xmax, ymin, ymax)
coord. ref. : lon/lat WGS 84 (EPSG:4326)
source      : elev.tif
name        : elevation
min value   :       141
max value : 547 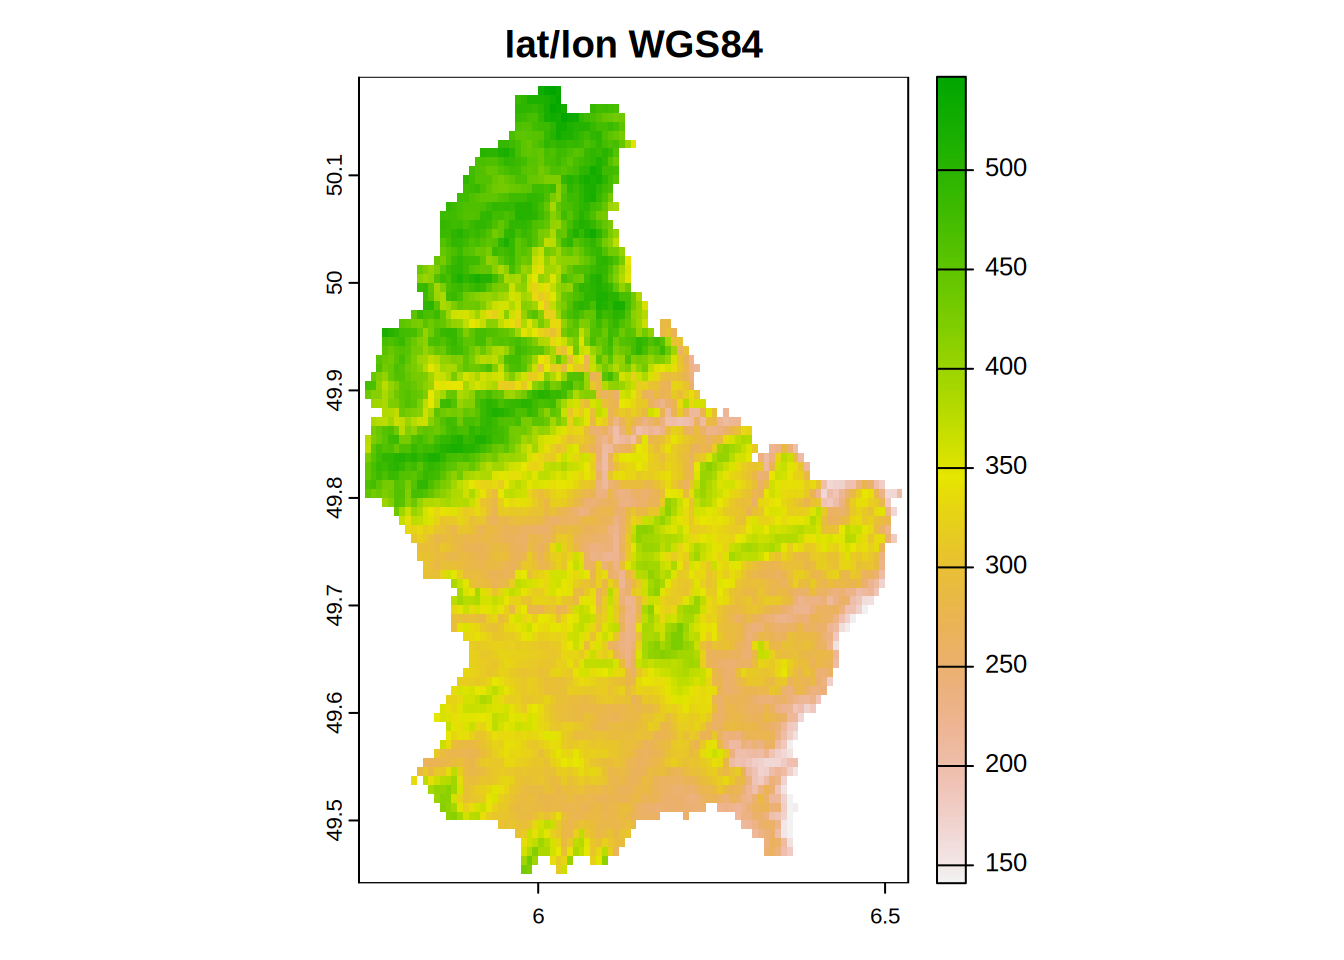
Vectors I: spatvector
 class       : SpatVector
 geometry    : polygons
 dimensions  : 12, 6  (geometries, attributes)
 extent      : 5.74414, 6.528252, 49.44781, 50.18162  (xmin, xmax, ymin, ymax)
 source      : lux.shp
 coord. ref. : lon/lat WGS 84 (EPSG:4326)
 names       :  ID_1   NAME_1  ID_2   NAME_2  AREA   POP
 type        : <num>    <chr> <num>    <chr> <num> <int>
 values      :     1 Diekirch     1 Clervaux   312 18081
                   1 Diekirch     2 Diekirch   218 32543
                   1 Diekirch     3  Redange   259 18664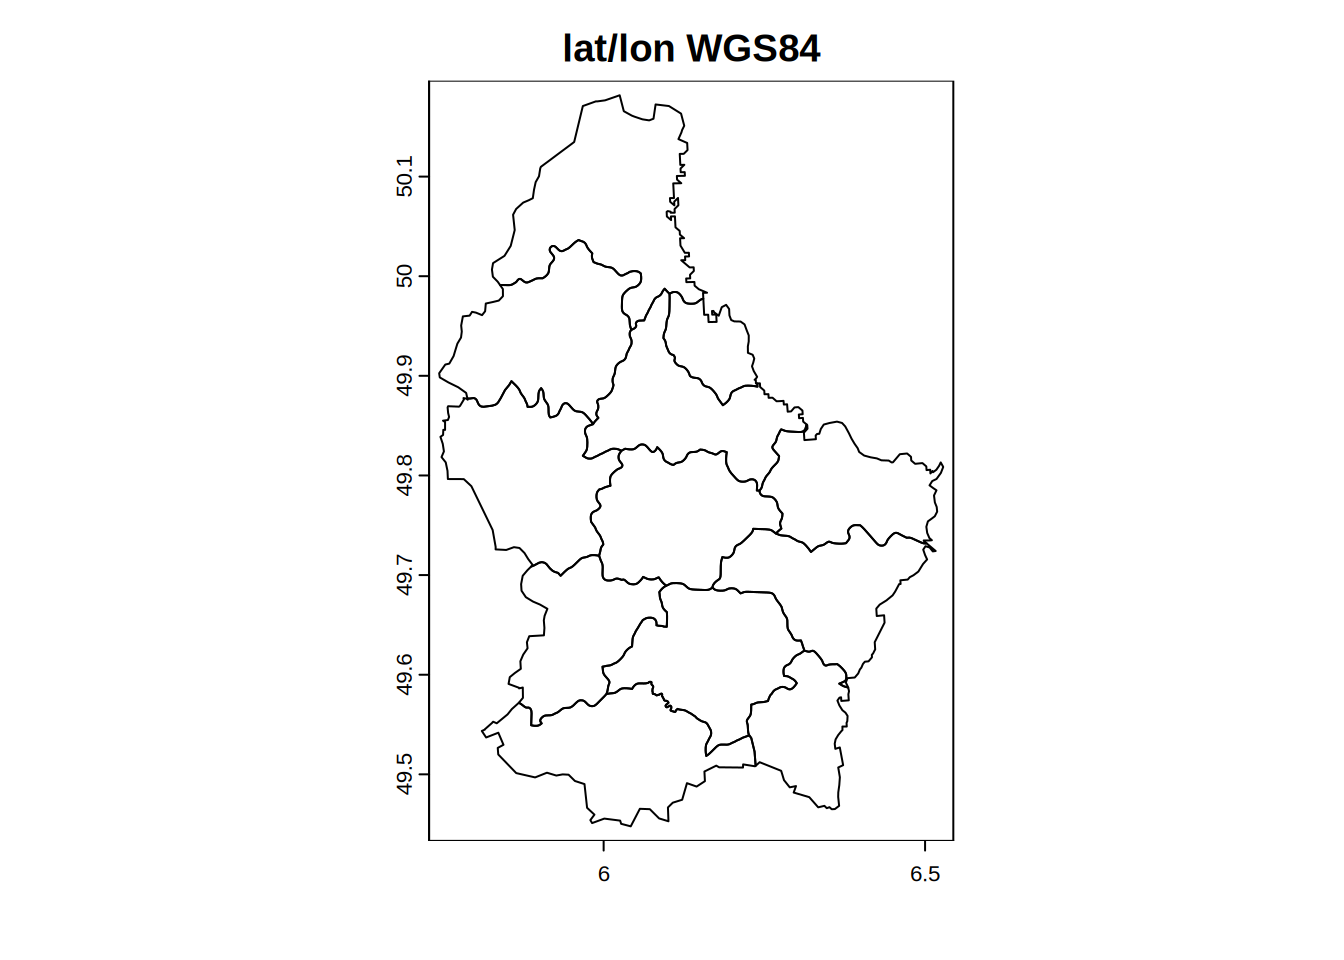
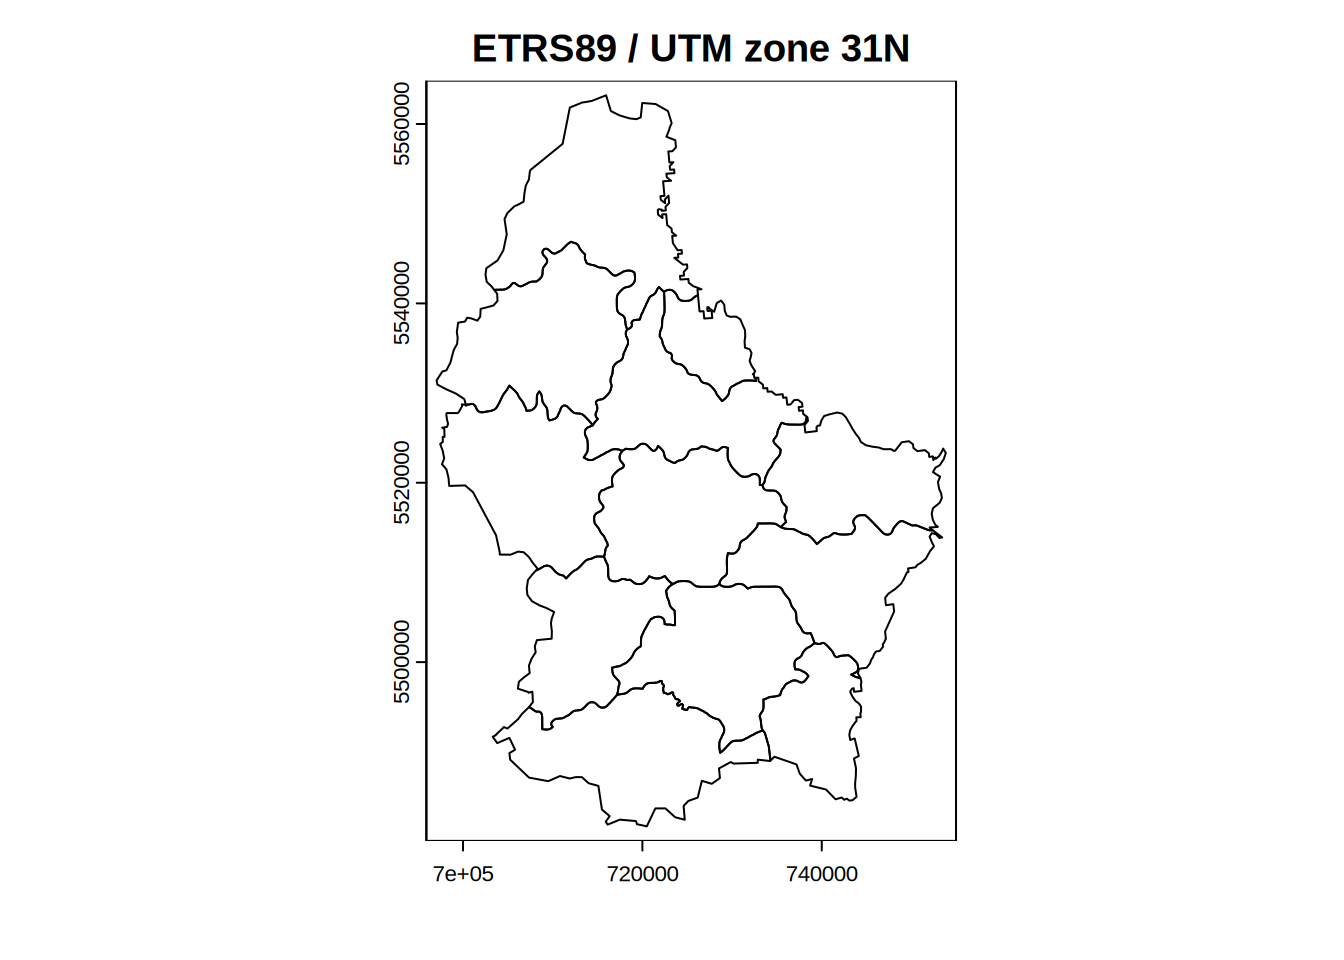
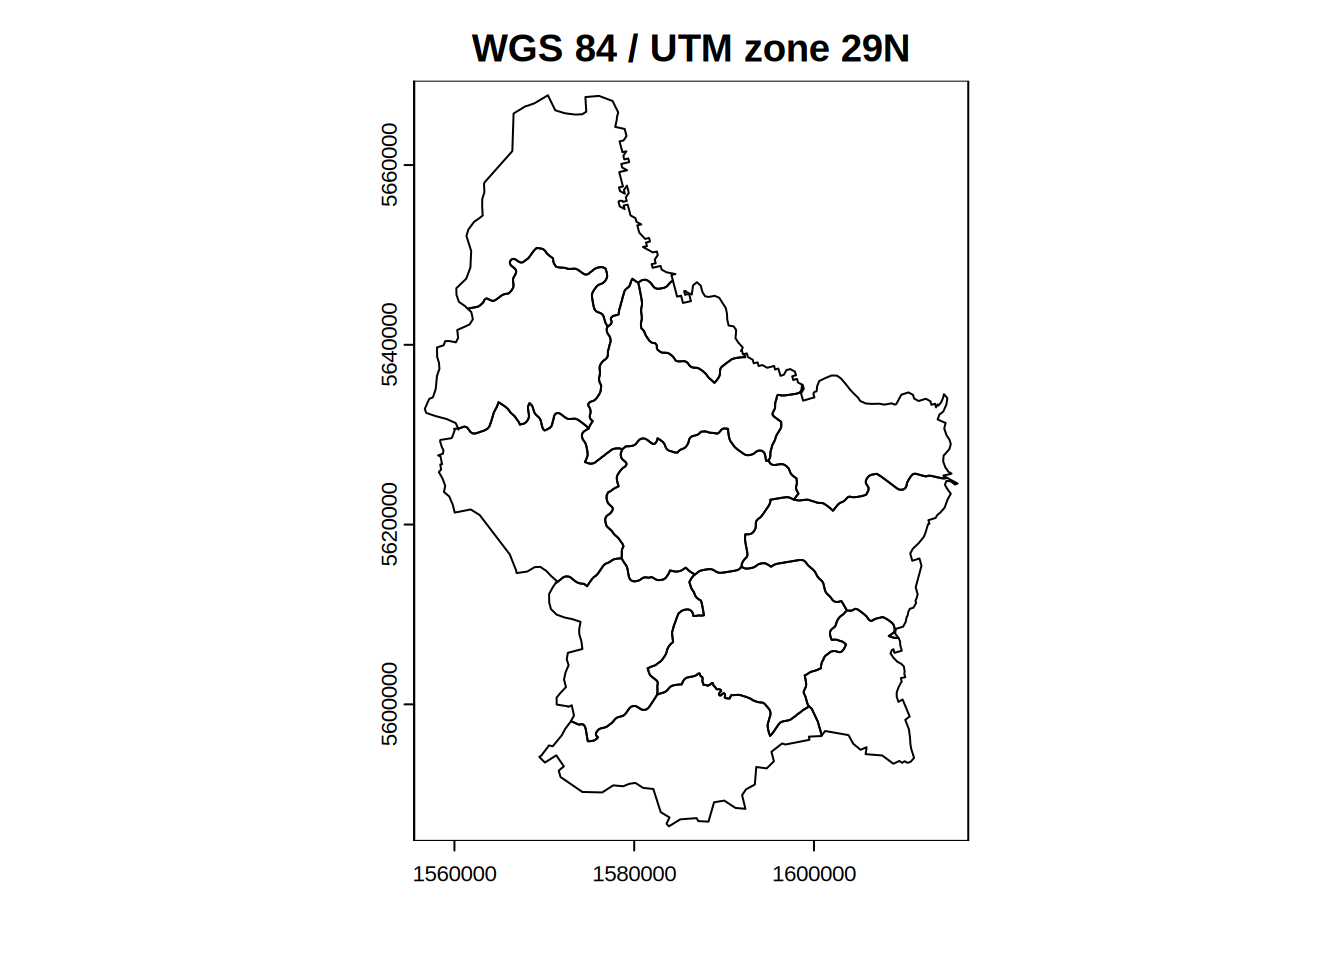
If you are interested in the difference between ETRS89 and WGS84 UTM format here is an article that explains it.
Vectors II: sf
Coordinate Reference System:
  User input: WGS 84
  wkt:
GEOGCRS["WGS 84",
    DATUM["World Geodetic System 1984",
        ELLIPSOID["WGS 84",6378137,298.257223563,
            LENGTHUNIT["metre",1]]],
    PRIMEM["Greenwich",0,
        ANGLEUNIT["degree",0.0174532925199433]],
    CS[ellipsoidal,2],
        AXIS["geodetic latitude (Lat)",north,
            ORDER[1],
            ANGLEUNIT["degree",0.0174532925199433]],
        AXIS["geodetic longitude (Lon)",east,
            ORDER[2],
            ANGLEUNIT["degree",0.0174532925199433]],
    ID["EPSG",4326]]
What if the projection is missing?
class       : SpatRaster
dimensions  : 10, 10, 1  (nrow, ncol, nlyr)
resolution  : 36, 18  (x, y)
extent      : -180, 180, -90, 90  (xmin, xmax, ymin, ymax)
coord. ref. :
class : SpatRaster
dimensions : 10, 10, 1 (nrow, ncol, nlyr)
resolution : 36, 18 (x, y)
extent : -180, 180, -90, 90 (xmin, xmax, ymin, ymax)
coord. ref. : WGS 84 / UTM zone 32N (EPSG:32632) With the sf package, the function would be st_crs(corrupted_vector) <- "EPSG:32632".