Map making
While we can make simple maps with the included plot function from terra or sf, there is also the tmap package that offers some more fancy options in terms of map making. With tmap you can build maps from the ground up (quite literally) as you stack different map layers on top of each other. The syntax is quite similar to ggplot as you can combine different layers with the + operator.
tmap
- Install and load the
tmappackage. - Visualize the land use, elevation and some of the OSM data we used previously.
- Use appropriate color scales!
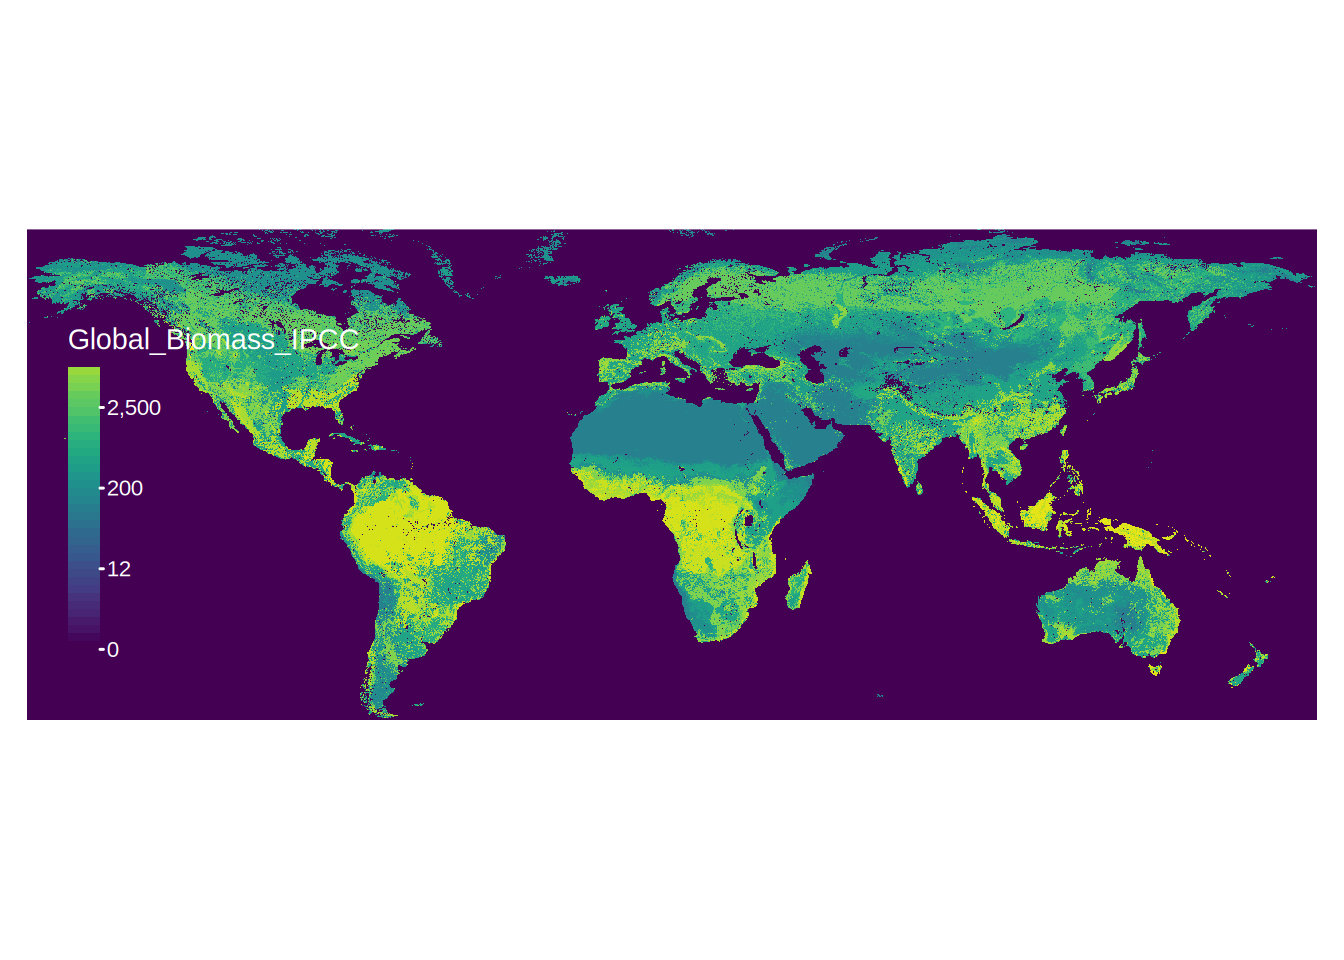
library(tmap)
library(viridis)


tm_shape(biomass, title = "Biomass")+
  tm_raster(col.scale = tm_scale_continuous_log1p(values = viridis(50)))+
  tm_layout(frame = FALSE,
            legend.position = c("left", "bottom"),
            legend.frame = FALSE,
            legend.text.color = "white", legend.title.color = "white",
            legend.reverse = TRUE)